
BELOW ARE SOME OF THE DASHBOARDS I'VE COME UP WITH TO ENABLE STAKEHOLDERS MAKE INFORMED BUSINESS DECISIONS.
A BRIEF EXPLANATION AND A LINK TO VIEW THE ENTIRE DASHBAORD IN TABLEAU PUBLIC.
SOME OF THE DASHBOARDS WERE BUILT USING MICROSOFT POWER BI AND EXCEL.
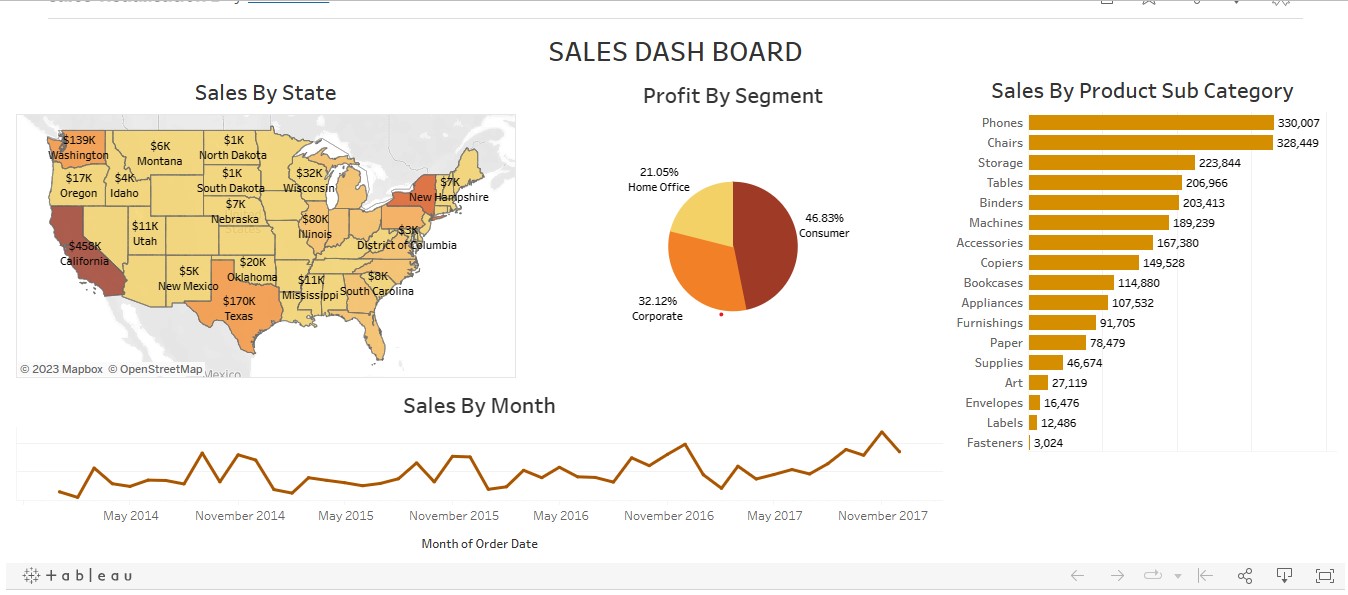
Retails Sales Analysis
Performing market segment with highest ans lowest profit, sales by products sub category, monthly sales, sales by states, were all the details that were required to enable the business grow. This was communicated to the stakeholders and business decisions were made based on facts.
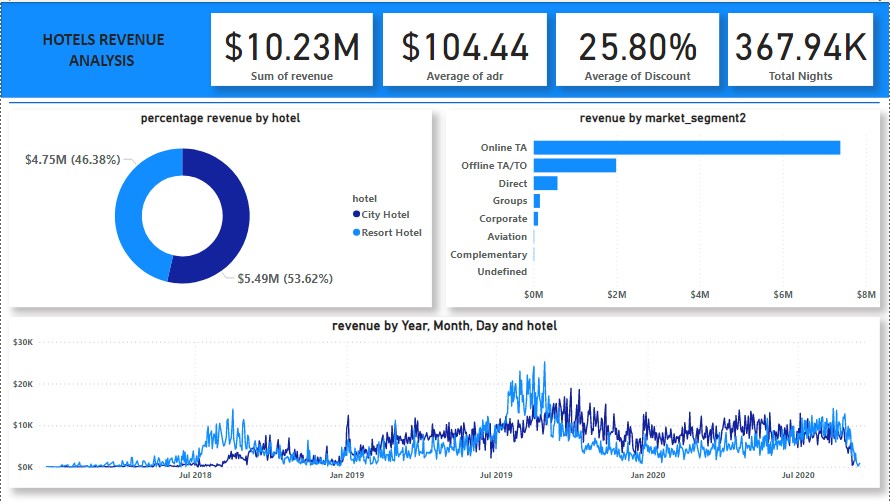
Hotel Database Analysis
The goal is to develop a database to analyze and visualize hotel data dashboard using Power BI to present to stakeholders.
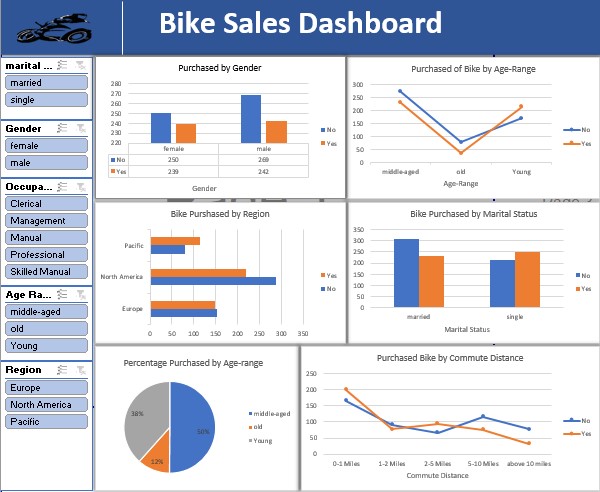
Bike Sales Dashboard
This dashboard exploring bike purchasing behavior based on a dataset of individuals' personal and demographic characteristics, as well as their bike purchasing behavior. It includes various charts and visualizations that summarize the data and highlight key insights about bike purchasing behavior..
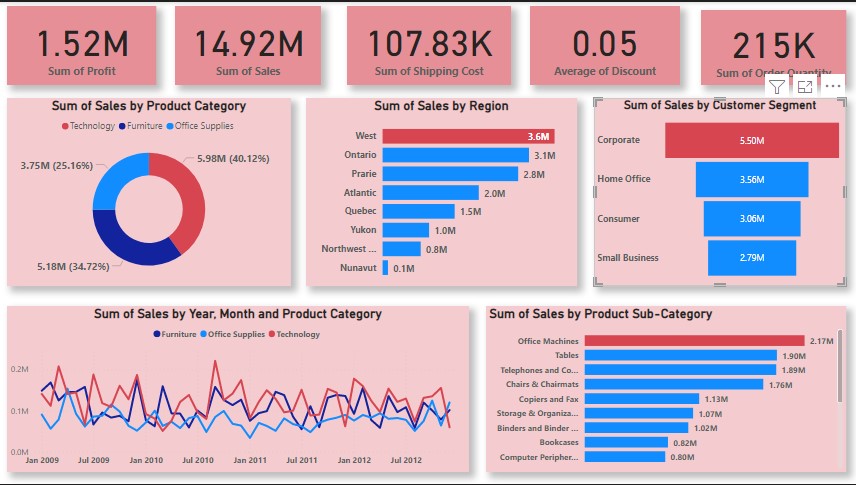
KMS Sales Analysis
The goal of this dashboard was to present to the stakeholders the sales progress so far. Total sales and profit, shipping cost, total quantity sold, and to also see how different customer segments and product categories are performing.
Phone
(+234) 816-8384860Address
00000Lagos,
Nigeria